MAP RIT Scores by Grade Level: 2026 Math Chart & Ranges
Your child came home with a number. 197. 215. 224. The teacher said "on grade level" or "above average" or simply moved on. You opened a browser and typed "average MAP® score for 5th grade" because the number, on its own, told you almost nothing.
This is the MAP RIT® score by grade chart you were looking for. Every grade from kindergarten through 8th. Fall, winter, and spring. The 50th percentile (the average), the 25th and 75th (the typical range), and the standard deviation. Plus what each band actually looks like in skills, because a chart of three-digit numbers without that context is just a chart of three-digit numbers.
The short answer
- The MAP math RIT scale runs from roughly 140 in early kindergarten to well above the typical 8th-grade range. It is equal-interval, so the distance from 200 to 210 represents the same amount of math learning as the distance from 230 to 240.
- The average 5th-grader scores around 206 in fall and 216 in spring. The average 7th-grader scores 217 in fall and 224 in spring. Averages climb about 10 points per year in grades 5 and 6, then about 7 points per year in grades 7 and 8.
- A score above average does not tell you which skills are secure yet. A 220 in 5th grade can hide a fraction skill that needs review as easily as a 200 can.
- The chart below is updated for 2026 and uses the NWEA 2025 math norms, the most recent published reference.
- Read on for the full table, what each band looks like in skill terms, and how to read your own child's number against it.
What this score means by grade
Percentiles are calculated from NWEA 2025 MAP Growth math norms (publicly published Quick Reference). A percentile says where a score sits against same-grade peers. It does not say which specific skills are secure and which need review; only a skill-level check can do that.
What the MAP RIT scale actually measures
A MAP RIT score is a point on a single scale that runs from below 140 to above 280. Every question on the MAP test is calibrated to a specific difficulty value on that scale. Each answer your child gives updates the test's estimate of where they sit, and the test adjusts the next question's difficulty accordingly.
Three properties of the scale matter for reading the chart:
- Equal intervals. A jump from 200 to 210 represents the same amount of math learning as a jump from 230 to 240. This is what makes it a scale and not a percentile.
- Continuous across grades. A 215 in 4th grade and a 215 in 7th grade are the same point on the ruler. The interpretation changes with grade. The number does not.
- No ceiling for advanced students. The scale runs well above an 8th-grader's typical range, so a precocious 5th-grader can still produce a meaningful number above 230.
The score is a level on a scale, not a grade or a percent correct. The percentile next to it is what places the level in context against same-grade peers. The two numbers do different jobs. For what the number does and does not mean, see what a MAP score really means. For a deeper dive on the 100-300 scale itself, see what the Helix Growth Score actually measures, and for the full reading of a MAP report, a parent's guide to MAP math scores.
The MAP RIT score chart by grade
The average (50th percentile) and standard-deviation columns below are NWEA's publicly published 2025 MAP Growth math norms. See NWEA's official 2025 Norms Quick Reference for the authoritative table. The 25th and 75th percentile columns are Helix's own calculation (roughly the median ± 0.67 standard deviations), shown to mark the typical middle-50% range. The 50th percentile is the median: half of same-grade students score below it, half above.
| Grade | Season | 25th %ile | Average (50th) | 75th %ile | Standard deviation |
|---|---|---|---|---|---|
| K | Fall | 133 | 141 | 149 | 12 |
| K | Winter | 142 | 151 | 160 | 13 |
| K | Spring | 149 | 158 | 167 | 13 |
| 1 | Fall | 150 | 159 | 168 | 13 |
| 1 | Winter | 159 | 168 | 177 | 14 |
| 1 | Spring | 166 | 175 | 184 | 14 |
| 2 | Fall | 163 | 173 | 183 | 15 |
| 2 | Winter | 170 | 181 | 192 | 16 |
| 2 | Spring | 176 | 187 | 198 | 16 |
| 3 | Fall | 173 | 184 | 195 | 16 |
| 3 | Winter | 182 | 193 | 204 | 16 |
| 3 | Spring | 188 | 199 | 210 | 17 |
| 4 | Fall | 186 | 197 | 208 | 16 |
| 4 | Winter | 193 | 204 | 215 | 17 |
| 4 | Spring | 198 | 210 | 222 | 18 |
| 5 | Fall | 195 | 206 | 217 | 16 |
| 5 | Winter | 201 | 212 | 223 | 17 |
| 5 | Spring | 204 | 216 | 228 | 18 |
| 6 | Fall | 199 | 210 | 221 | 16 |
| 6 | Winter | 205 | 216 | 227 | 17 |
| 6 | Spring | 208 | 220 | 232 | 18 |
| 7 | Fall | 206 | 217 | 228 | 17 |
| 7 | Winter | 209 | 221 | 233 | 18 |
| 7 | Spring | 211 | 224 | 237 | 19 |
| 8 | Fall | 210 | 222 | 234 | 18 |
| 8 | Winter | 213 | 226 | 239 | 19 |
| 8 | Spring | 216 | 229 | 242 | 20 |
The 50th-percentile and standard-deviation figures are NWEA's publicly published 2025 MAP Growth math norms (official Quick Reference); the 25th and 75th columns are Helix's own calculation. Norms reflect a representative U.S. student population sampled in 2024. MAP® and RIT® are registered trademarks of NWEA; Helix Math is not affiliated with or endorsed by NWEA.
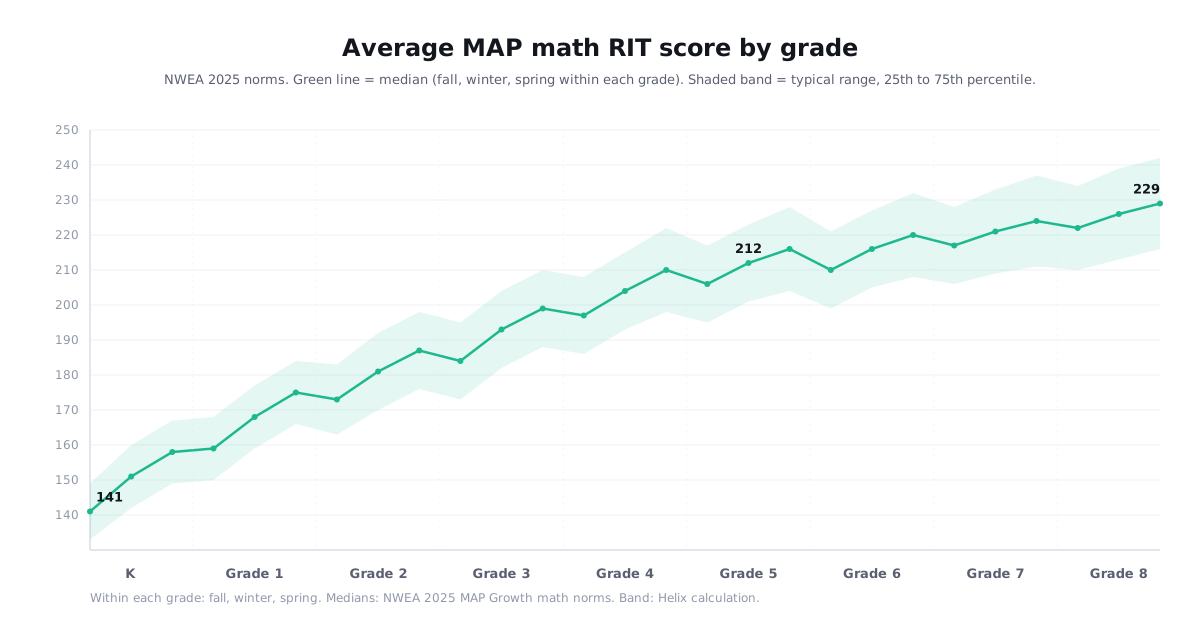
Three things to notice before the band-by-band walk-through:
- The fall-to-spring jump shrinks as students get older: about 15 to 17 points per year in the early grades, down to about 7 points by 8th grade (the full growth table is below). That gap is the year's growth, and it is what NWEA's growth norms compare your child's progress against.
- The standard deviation grows with grade. It is 16 in 3rd grade, 20 in 8th. Older students spread out more, which is why a single point of "above average" feels different at different ages.
- The typical range is wide. The 25th-to-75th band spans about 18 points in kindergarten and 1st grade, and about 25 points by 8th grade. A score anywhere inside that band is typical, regardless of which side of the median it falls on.
Have a score, but not a plan?
A MAP score tells you how your child performed overall. Helix looks one layer lower: which skills are secure, which are still developing, and what to practice next.
Typical growth per year, by grade
The same 2025 norms publish how much the average student's math RIT grows across the year. This answers the other question parents bring to the chart: not "where is my child" but "how much should the number move."
| Grade | Fall to winter | Winter to spring | Full year (fall to spring) |
|---|---|---|---|
| K | 9 | 7 | 17 |
| 1 | 9 | 7 | 16 |
| 2 | 8 | 6 | 15 |
| 3 | 9 | 6 | 15 |
| 4 | 7 | 6 | 13 |
| 5 | 6 | 4 | 10 |
| 6 | 6 | 4 | 10 |
| 7 | 4 | 3 | 7 |
| 8 | 4 | 3 | 7 |
Mean student growth in RIT points, NWEA 2025 MAP Growth math student growth norms (official Quick Reference). These are grade-level averages, not promises for an individual child. A child's expected growth also depends on their starting score, test timing, and context.
Two readings worth taking from it. First, growth compresses with age: a 4th-grader gaining 13 points in a year is exactly typical, and an 8th-grader gaining 7 is too. Judging an 8th-grader against a 4th-grade growth rate makes normal progress look like a problem. Second, most of the year's growth lands by winter at every grade, so a fall-to-winter report that shows half the annual number is on pace, not behind.
What each grade band looks like in skill terms
A RIT score gives you a broad level. The next question is which skills make up that level. Here is what the typical-range scores at each grade look like when you translate them back into the Common Core skills the test is sampling. We use the spring average and typical range for each grade.
Kindergarten through 2nd grade (RIT 140 to 200)
At this stage the test is sampling counting, place value to 100, addition and subtraction within 20 (then 100), and the very earliest geometry and measurement work. A kindergartener in the typical spring range (149 to 167) is counting reliably, recognizing teen-number place value, and beginning single-digit addition. A 2nd-grader in the typical spring range (176 to 198) is fluent with addition and subtraction within 100, understands place value to 1,000, and is starting to read clocks, rulers, and simple bar graphs.
3rd grade (RIT 184 fall to 199 spring)
Multiplication and division enter the picture. The typical 3rd-grade spring score (188 to 210) covers multiplication facts through 10×10, the start of fractions as equal parts of a whole (3.NF.A.1), area as the number of unit squares (3.MD.C.6), and elapsed time. A 3rd-grader on the median has working fluency with the times-tables conceptually, not just by rote.
4th grade (RIT 197 fall to 210 spring)
Fractions deepen. The typical 4th-grade spring score (198 to 222) covers equivalent fractions (4.NF.A.1), comparing fractions (4.NF.A.2), multi-digit multiplication and division, and the first introduction to angles in degrees. Two-digit-by-two-digit multiplication is expected to be fluent by spring. The fraction work in this grade is the foundation everything in 5th, 6th, and 7th grade rests on.
5th grade (RIT 206 fall to 216 spring)
The pivot year. The typical 5th-grade spring score (204 to 228) covers operations with fractions (adding, subtracting, multiplying, dividing) (5.NF), the introduction of decimals to the thousandths (5.NBT.A.3), volume of rectangular prisms (5.MD.C.5), and the coordinate plane in the first quadrant (5.G.A.1). By spring of 5th grade, students are expected to treat fractions as numbers they can operate on, not just pieces of a shape. If that is still unfinished, it follows them into ratios and proportions in 6th.
To see how your own 5th-grader handles this material, our free grade 5 MAP math practice problems are a 14-question check covering decimals, the four fraction operations, volume, and geometry. No login, instant feedback by topic.
6th grade (RIT 210 fall to 220 spring)
Ratios and proportions take center stage. The typical 6th-grade spring score (208 to 232) covers ratio reasoning (6.RP.A), unit rate (6.RP.A.2), percent as a ratio per 100 (6.RP.A.3.c), dividing fractions by fractions (6.NS.A.1), and the first use of variables in expressions (6.EE). A 6th-grader whose 5th-grade fraction skills are not yet secure will often struggle here, because ratio problems build directly on fraction reasoning.
7th grade (RIT 217 fall to 224 spring)
Proportional reasoning and integers. The typical 7th-grade spring score (211 to 237) covers proportional relationships (7.RP.A.2), scale drawings (7.G.A.1), operations with rational numbers including negatives (7.NS.A.1), and one-variable equations of the form px + q = r (7.EE.B.4.a). This is the grade where earlier gaps often become more visible, because proportional reasoning and algebraic notation both depend on skills from previous years.
To see how your own 7th-grader handles this material, our free grade 7 MAP math practice problems are a 14-question check covering proportions, percents, integers, equations, and probability. No login, instant feedback by topic.
8th grade (RIT 222 fall to 229 spring)
The pre-algebra year. The typical 8th-grade spring score (216 to 242) covers linear equations (8.EE.C.7), systems of equations (8.EE.C.8), functions as inputs and outputs (8.F.A.1), the Pythagorean theorem (8.G.B.7), and the first formal exposure to slope (8.EE.B.5). An 8th-grader near the median is usually working on many of the skills Algebra I expects: equations, functions, slope, and proportional relationships. An 8th-grader well below the typical range often needs targeted review before Algebra I, especially in equations, fractions, ratios, and proportional reasoning.
How to read your own child's score against the chart
Take your child's most recent RIT score and the season it was administered in (fall, winter, or spring) and find the row in the table above. Three readings:
If the score is between the 25th and 75th columns, your child is in the typical range. Above the median, "above average." Below, "below average." Both are normal. Roughly half of all same-grade students will be in each half by definition.
If the score is above the 75th column, your child is in the top quartile for the grade. The percentile is genuinely high. This is the band where parents most often miss the gap question. Depending on the season, a 230 in 5th grade can be a very high score. But a high score can still hide a fraction skill that needs review, one that will not surface until 6th-grade ratios.
If the score is below the 25th column, your child is in the bottom quartile. This is the band where targeted practice has the most leverage, and where percentile language can make the problem feel bigger than it is. A 195 in 5th-grade fall sits at the lower end of the typical range for the grade, and close to the 4th-grade fall average of 197. That usually points to specific prerequisite skills to review, not a child who is "bad at math." The useful next step is finding which earlier skills are causing the trouble.
A single RIT score is one moment in time. Two MAP tests on the same student a week apart can vary by three to five points without anything having changed about the student. If your child's number is right at a band boundary, the band is approximate, not absolute.
If you want to see which skills are behind your child's score, the Helix Program begins with a 30 to 40 minute diagnostic. It produces a skill map you can read alongside the MAP report, names the priority skills, and turns the results into targeted practice.
See a sample report →Start the Helix Program$19/month during beta, 7-day free trial, cancel anytime.
Why "on grade level" doesn't tell you what to practice
A score near the median is usually reassuring. It means your child performed similarly to many students in the same grade and season.
But an overall score does not show the full skill picture. Two 5th-graders with the same 216 spring score can need very different support. One may be secure in number sense and operations but need review in geometry. Another may show the opposite pattern. The overall RIT score summarizes performance across math areas. The broad instructional-area scores on the report add a little more detail, but they usually do not name the exact skill to practice next.
The average hides the gaps. This is the single most important sentence to keep in mind when reading a MAP chart. A child can be exactly at the median for their grade and still have a foundation skill that will become a problem next year. The chart shows where your child's score sits compared with same-grade peers. It does not show the specific skills underneath that score.
A MAP report may tell you the score is 216. Whether the skill that needs review is fractions, decimals, or the start of ratio reasoning is a question the report was not designed to answer. That distinction is the difference between a number you can act on and a number you can only worry about.
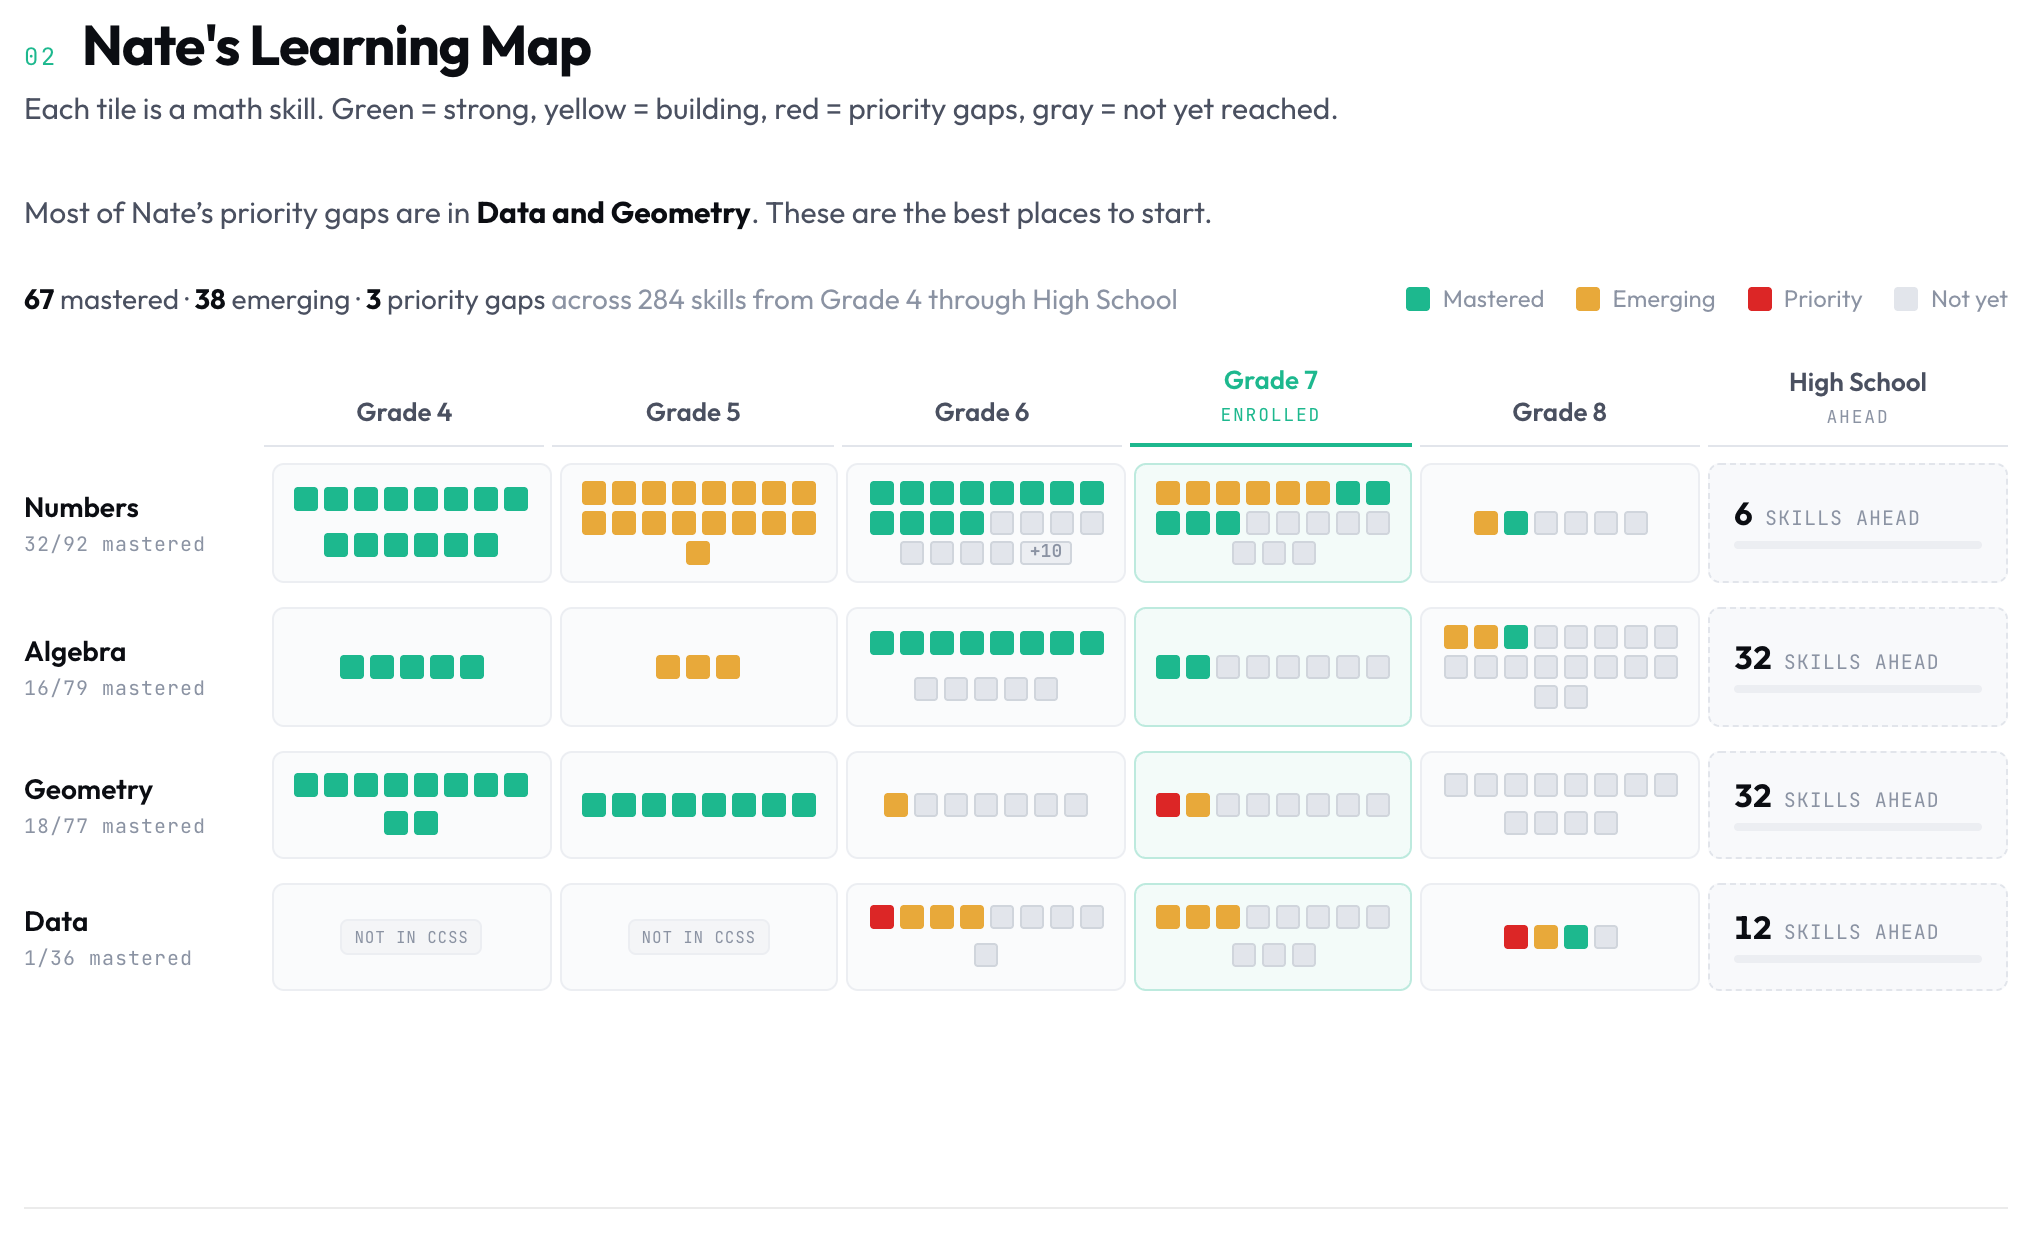
That is what a skill-level diagnostic is built for: which skills are secure, which are still developing, and what to practice first. It is meant to be read alongside a MAP score, not to replace the school report.
What a specific score means
The chart above is the broad picture. If you want a closer read on one exact number, these breakdowns walk through a single score grade by grade: what a 210, 215, 221, 225, 230, or 240 means at your child's grade and season.
What you can do this week
If your child's MAP score just came home and you want to do something concrete, not panicked:
- Find their score in the table above. Compare to the average and the typical range for their grade and season. Note whether they are in the top, middle, or bottom quartile. Write the number on a sticky note. That is your reference.
- Look at growth, not just level. If you have last year's score, the difference is the more important number. The growth table above shows what typical year-over-year growth looks like at each grade in the 2025 norms. A student growing 12 points a year from a starting RIT of 195 may be making solid progress. A student sitting around 215 for two years may be worth a closer look, even though 215 once looked reassuring at the grade-5 median.
- Look at the broad math-area scores. Most school MAP reports break the overall RIT into three or four instructional areas. If one area is noticeably lower than the others, that is a good place to look more closely. It will not name the exact skill, but it points you toward the right part of math to review.
- Don't show the score to a child who isn't asking about it. If they are not anxious, you don't have to make them anxious. The number is for you to plan with, not for them to feel measured by.
- Look for one specific skill, not a global judgement. "Adding fractions with unlike denominators" is a workable target. "Doing better at math" is not.
Common questions about MAP scores by grade
What is the highest possible MAP score?
There is no fixed maximum. The RIT scale is open-ended, and grade-level medians top out around 229 by spring of 8th grade in the 2025 norms. A middle-school score in the 250s or above sits far beyond the typical range for the grade. Read it as "well above grade-level norms," not as a percentage of some ceiling.
What is a good MAP math score for my child's grade?
A score at or above the bolded median column for the grade and season is at or above average, and anything between the 25th and 75th percentile columns is squarely typical. Season matters: a 210 in fall of 6th grade sits exactly at the median, while the same 210 in spring is below it.
How many points should a MAP score go up in a year?
Average full-year math growth runs from about 17 points in kindergarten down to about 7 points by 8th grade; the growth table above has every grade. These are grade-level averages, not targets for an individual child, and expected growth also depends on the starting score and test timing.
Can a MAP score go down?
Yes, and a single drop is usually noise rather than lost learning. The same student can score three to five points apart on tests taken a week apart. Look at the trend across two or three test events before reading anything into one decline.
Is a MAP score the same as a grade level?
No. The RIT scale is one continuous ruler across all grades, so there is no score that "equals" 5th grade. A 5th-grader and a 7th-grader can both score 215; the score describes a point on the scale, and grade-level expectations describe where their curriculum is.
The chart gives you a reference point. It tells you where your child's score sits, not what to do next or which skill to start with. That is what a skill-level diagnostic is for.
A MAP RIT score is one of the most useful single numbers you will get about your child's math. It is calibrated, equal-interval, comparable across grades, and based on a representative sample of millions of U.S. students. But it is one number. The work happens one layer below.
The chart above gives you the broad reference point. It tells you whether your child's score is typical, above average, or below average for their grade and season.
The next question is more practical: which skills should they work on first? That is where Helix Math fits. The Helix Program begins with a diagnostic, builds a skill map, and turns that map into targeted daily practice. If you would rather see what that looks like before starting, begin with the sample report, or try a free, no-login practice set: free grade 5 MAP math practice problems or free grade 7 MAP math practice problems.
Start the Helix Program →See a sample report$19/month during beta, 7-day free trial, cancel anytime.
The number is the start of the work, not the end of it.
MAP® and RIT® are registered trademarks of NWEA. Helix Math is not affiliated with or endorsed by NWEA.