Same MAP Math Score, Different Math Strengths
Two students can earn the same MAP® math score and still need different kinds of practice. One overall score summarizes the whole test, so it can't show which areas went well and which need more work. Here is why, and what to look at next.
Your child is in sixth grade and scored a 221 on fall MAP math. The percentile came back at 75. A few weeks into the school year, ratio homework is a struggle, and the teacher mentions that proportional reasoning needs more practice. A strong score and a hard unit can both be true. The overall score summarizes the whole test, and ratios are one topic within it.
The short answer
- The overall math RIT® (sometimes called the composite score) is not an average of separate skill-area scores. It is estimated from all of a student's answers together, on one scale. That is why it can't show which parts of the test went well and which didn't.
- Two students with the same overall score can have very different instructional-area results: one stronger in number work such as fractions and decimals, the other stronger in algebra.
- A typical overall score doesn't mean every skill is in place. One topic, such as ratios or dividing fractions, can need practice while the overall score stays at or above the median.
- Many reports sent home show only the overall score and percentile. The instructional-area results (sometimes called goal scores) appear on the Student Profile report, so ask the school if you haven't seen them.
- If the overall score looks fine but your child is struggling in class, look for a Suggested Area of Focus on that report, and ask the teacher which specific skills in that area to practice.
How a 221 can mean two completely different things
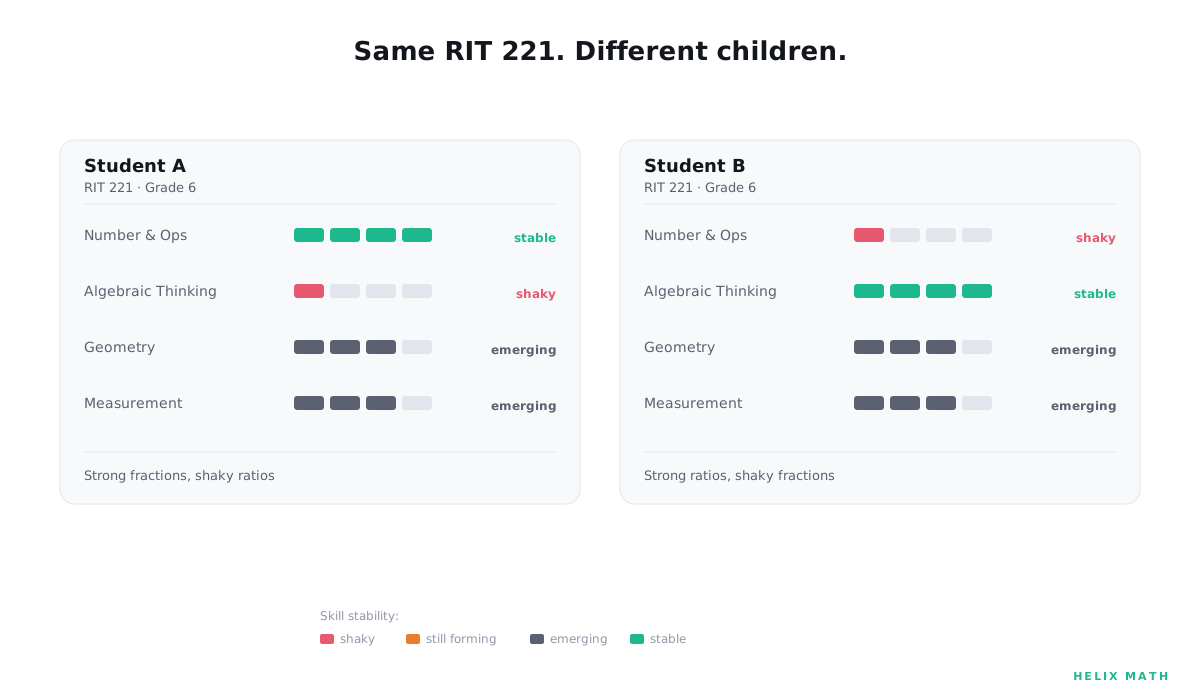
Two sixth graders take MAP in the fall. Both finish with a math RIT of 221. The composite puts both students at the 75th percentile. Yet the two students' instructional-area scores, and the practice each one needs next, look quite different. Student A and Student B are hypothetical. The scores are invented for illustration and don't come from real reports. NWEA estimates the overall score and each area score separately, so the 221 isn't calculated from the area scores.
Student A (hypothetical). On the Number area, Student A scores 235. On Algebra, 205. In class, that pattern shows up as accurate work with fractions and decimals, alongside slower progress with writing and evaluating expressions (6.EE.A.2) and solving one-step equations such as x + 3.5 = 9 (6.EE.B.7). Expressions and equations come back in seventh grade (7.EE), so Algebra is the area worth a closer look now.
Student B (hypothetical). The reverse. Algebra: 238. Number: 208. In class, Student B handles expressions and simple equations well, but dividing fractions (6.NS.A.1) and multi-digit decimal operations (6.NS.B.3) take more practice. Fraction and decimal work comes back in seventh grade with operations on rational numbers (7.NS.A), so for Student B, Number is the area worth a closer look.
The overall score summarizes the whole test. It doesn't show which areas pulled it up and which held it back. The instructional-area scores give a rough direction, and the student's own work shows the specific skills.
What a composite math score actually is (and what it can't show)
The overall math RIT, sometimes called the composite score, is not an average of the instructional-area scores. MAP Growth is adaptive: each question depends on how the student answered the earlier ones, and the overall RIT is estimated from all of the answers together, on one scale. NWEA also reports a separate score for each instructional area, based on just the questions in that area. On the current Math 6+ test, given from grade 6 up, the areas are Number, Algebra, Geometry, and Probability & Statistics. Schools using an older or state-aligned version may show other names, such as Operations and Algebraic Thinking or The Real and Complex Number Systems.
A single overall score is steady by design. That makes it good for tracking growth and for comparing a student with a national reference group. It is also why the overall score can't show which areas went well and which didn't.
The table below shows four sixth graders, all with an overall RIT of 221 in fall. Students A and B are the two above. All four are hypothetical, and the numbers are invented. Averaging a row won't give you the overall score, because NWEA estimates each score separately.
| Student | Overall RIT | Number | Algebra | Geometry | Probability & Statistics |
|---|---|---|---|---|---|
| A | 221 | 235 | 205 | 220 | 218 |
| B | 221 | 208 | 238 | 218 | 215 |
| C | 221 | 218 | 219 | 221 | 222 |
| D | 221 | 208 | 225 | 228 | 212 |
Student C is even across the areas. Students A, B, and D are not. The overall score alone can't tell you which pattern your child has. The instructional-area scores give a rough direction, and your child's work on specific skills tells you more.
Even the area scores stop short of individual skills. Knowing that Number came out lower doesn't tell you whether the trouble is dividing fractions, decimal operations, or something else in that area. That finer answer comes from looking at the work, and it is the one that shapes what to practice next.
For an example of that skill-level view, see the sample report from Helix's optional diagnostic.
Why sixth-grade ratios matter for eighth-grade algebra
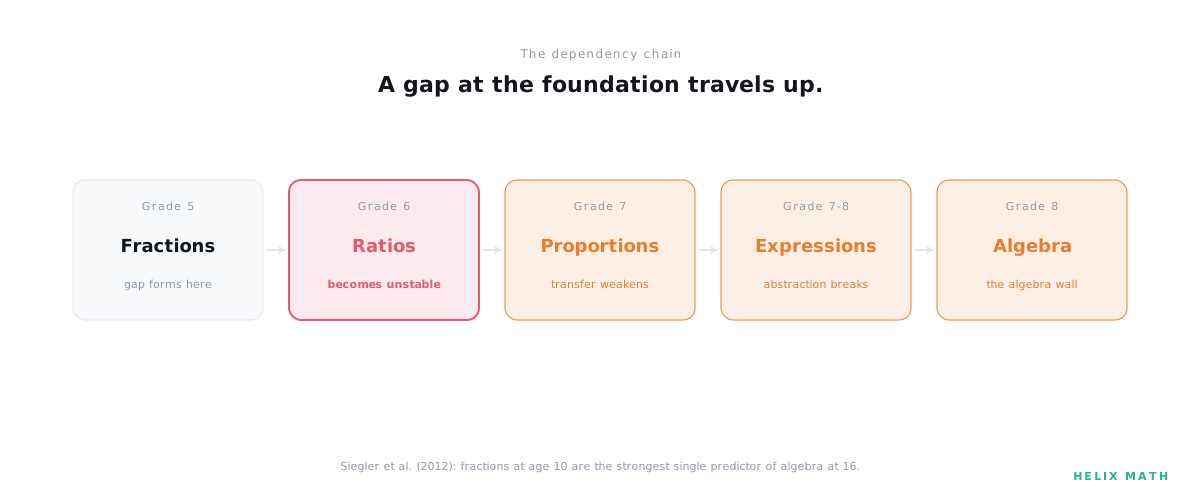
Ratios show why the specific skill matters more than the summary. In sixth grade, students learn to reason with ratios and unit rates: if 3 notebooks cost $4.50, one notebook costs $1.50 (6.RP.A.3b). In seventh grade, that becomes proportional relationships: recognizing when two quantities change at a constant rate, as in y = 1.5x, and finding the unit rate in a table or graph (7.RP.A.2). In eighth grade, the same idea returns as slope: the unit rate in a proportional relationship is the slope of its graph (8.EE.B.5), which leads into linear equations and functions.
So a student who finds unit rates hard in sixth grade will meet that idea again in seventh and eighth grade. That isn't a prediction about any one child. It is a reason to practice the earlier skill when it first comes up, rather than waiting for a later unit to show it.
The overall score can stay at or above the median while one topic like this needs work, because a single topic is a small share of the questions on the test. An instructional-area score won't name the skill either. A unit test, a homework set, or a few problems done at home will.
This is how math gaps carry forward when left unaddressed: not as a sudden drop, but as a later topic that is harder than it needs to be because an earlier one was never quite in place.
Where the goal-area scores live (and why many parents never see them)
MAP reports a score for each instructional area, sometimes called goal scores. Not every report a family receives includes them. Some schools send home a summary with only the overall score and percentile. The instructional-area results appear on the Student Profile report, so if you haven't seen them, ask your child's teacher or school for the instructional-area results from the last test.
When you have them, compare each area with your child's overall score. The Student Profile report may label an area as a Relative Strength or a Suggested Area of Focus. A student can have one, both, or neither, so a report without these labels is normal. Both labels compare the area's score with your child's own overall score, not with other students, and NWEA allows for measurement error before applying either one.
A caveat on precision: NWEA notes that instructional-area scores have wider confidence intervals than the overall RIT, because each area rests on far fewer questions. Treat one large difference as a question, not a conclusion. A pattern across two test windows (fall and spring, or spring and the following fall) tells you more, especially when it matches what you see in class or homework.
If the same area comes out lower across test windows, and it matches classroom experience, the next step is to find which specific skills in that area need practice. We explain how to recognize a skill that needs more practice.
What you can do this week
Four actions.
One. Ask for the instructional-area results if you only have the summary. Call the school office or email your child's teacher, and ask for "the Student Profile report, or the instructional-area results from the last MAP test."
Two. Look at the instructional-area results, not just the overall score. Note any area labeled a Suggested Area of Focus or a Relative Strength, and write down which area it is.
Three. If one area came out lower, ask the teacher which specific skills in that area came up in the last unit. Frame it as a question, not a concern: "The Number score came out lower than the rest of the test. Which fraction or decimal skills from class might need more practice?" Often the teacher can name a unit or two. Even if not, the question keeps the conversation on specific skills rather than the score.
Four. Start practice on the specific skills. If you already have your child's MAP score, the Helix Program uses it as a starting estimate, so no additional test is needed, and adjusts the plan as your child practices. Families without a recent score can begin with the optional 30 to 40 minute Helix diagnostic, which is included in the program. That step, finding which specific skills need practice, is what Helix Math was built for. If you'd like a quick look at your child's work first, a free practice check by grade (free grade 5 practice problems, free grade 7 practice problems) has fourteen questions, takes about fifteen minutes, needs no sign-up, and gives you a summary by topic at the end.
The number alone will not tell you
The overall score is useful. It tracks growth. It places a student in a national context. But it summarizes a whole test, so the detail sits in the instructional-area results and, more precisely, in your child's work.
Two students can score the same 221 for different reasons and need different practice next. The overall score, on its own, won't tell you which is which. The instructional-area results give a rough direction. A look at specific skills gives the finer picture.
If your child's overall score looks typical but homework says something else, you are not imagining it. The instructional-area results may already point to the area worth a closer look. The MAP report does not bury the information. It just does not put it in the headline.
MAP® and RIT® are registered trademarks of NWEA. Helix Math is not affiliated with or endorsed by NWEA.